The Hidden Risk in ‘Highly Liquid’ Collateral
In private banking, "highly liquid" collateral is often treated as low-risk. Blue-chip equities, major index ETFs, and investment-grade bonds are routinely accepted with minimal haircuts. But this confidence rests on an assumption that rarely gets tested: that liquidity observed in normal markets will persist under stress.
This article examines the liquidity illusion—the gap between how liquid assets appear in calm conditions and how they actually behave when markets turn. For private banks managing Lombard credit, understanding this gap is essential for effective risk management.
The Liquidity Illusion: What Banks Often Miss
Liquidity is typically measured by trading volume, bid-ask spreads, and market depth. By these measures, assets like Apple stock, S&P 500 ETFs, or German government bonds appear highly liquid—and under normal conditions, they are.
But liquidity is not a fixed property of an asset. It is a market condition that varies with:
- Market sentiment — Fear drives liquidity providers to step back
- Systemic stress — When many participants need to sell simultaneously
- Concentration — Large positions relative to typical daily volume
- Time horizon — Urgent liquidation versus orderly unwinding
- Market structure — Electronic markets can see liquidity vanish in milliseconds
The critical insight: liquidity measured during calm periods tells you little about liquidity during stress.
The Liquidity Paradox
The assets that appear most liquid in normal times are often the first to be sold during stress—precisely because they can be sold. This concentrated selling pressure can overwhelm normal market-making capacity, causing spreads to widen dramatically and depth to disappear.
When "Liquid" Becomes Illiquid: Real-World Examples
The Flash Crash of 2010
On May 6, 2010, the Dow Jones Industrial Average dropped nearly 1,000 points in minutes before largely recovering. During those minutes, many "highly liquid" stocks traded at prices that made no economic sense—some fell to pennies while others spiked to absurd levels.
March 2020 COVID Crisis
The March 2020 market turmoil revealed liquidity stress even in the most liquid markets. US Treasury bonds—traditionally the world's most liquid assets—experienced significant trading disruptions. ETF prices disconnected from their underlying asset values.
The Concentration Problem
Private banks often find that their clients hold similar positions—popular stocks, well-known ETFs, or widely-held bonds. During stress, this creates hidden concentration risk:
- Multiple margin calls may require selling the same securities
- The bank's aggregate position may be large relative to stressed-market liquidity
- Liquidation by one client affects prices for all other clients holding the same assets
How SpeciCRED Addresses Liquidity Risk
SpeciCRED was built with these challenges in mind, providing private banks with tools to see beyond the liquidity illusion.
See Beyond the Liquidity Illusion
SpeciCRED gives private banks the tools to understand true collateral liquidity—not just what appears on the surface during calm markets.
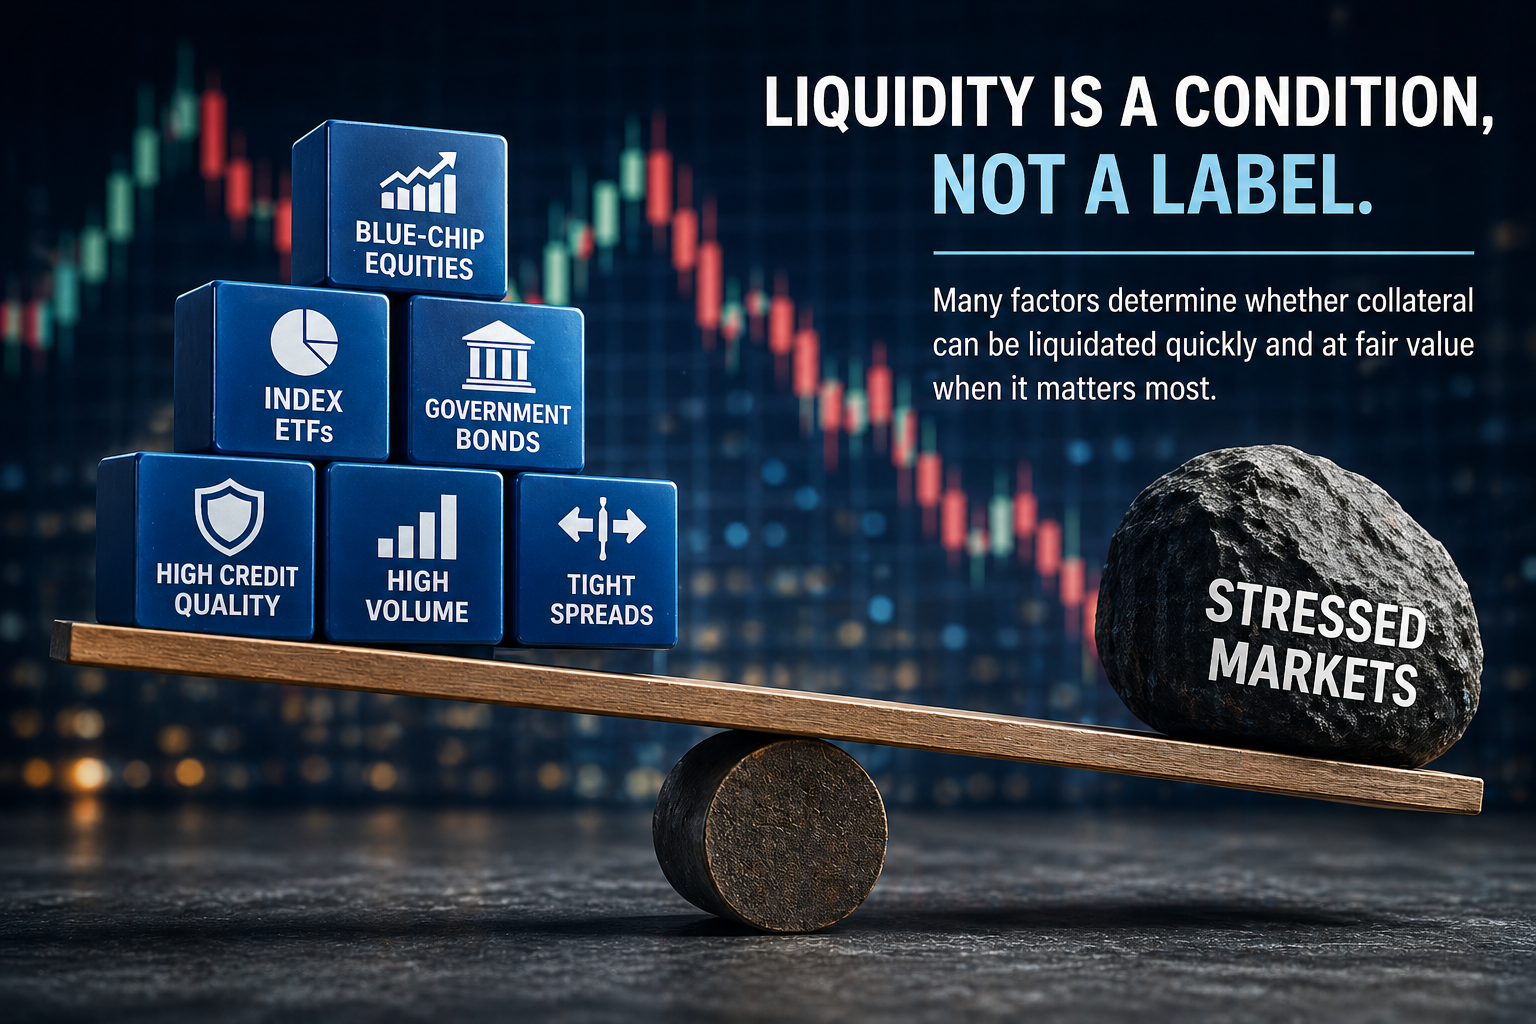
Request a Demo Learn MoreConclusion: Liquidity Is a Condition, Not a Label
The distinction between "liquid" and "illiquid" assets is useful for general categorisation but dangerous for risk management. All assets exist on a spectrum of liquidity that shifts with market conditions.
Banks that answer these questions honestly—and build monitoring systems that track liquidity dynamically—will be far better prepared when the next stress event reveals the true nature of their "highly liquid" collateral.
Frequently Asked Questions
The liquidity illusion refers to the gap between how liquid assets appear during normal market conditions and how they actually behave during stress. Assets that seem highly liquid—based on normal trading volumes and tight spreads—may become difficult or impossible to sell at reasonable prices during market turmoil.
Bid-ask spreads widen during stress because market-makers and liquidity providers become less willing to hold inventory. When uncertainty rises, the risk of buying an asset and seeing its price fall before selling it increases dramatically.
Banks should move beyond static haircuts to dynamic approaches that consider: stressed-market liquidity rather than normal conditions, position size relative to stressed daily volumes, likely price impact from forced liquidation, and aggregate bank exposure to the same assets across all clients.
Position size relative to market liquidity is crucial for understanding true liquidation risk. A position that seems small relative to the total market cap of an asset may actually be large relative to typical daily trading volume—especially during stressed conditions.
Real-time liquidity monitoring requires tracking multiple indicators: bid-ask spreads across key collateral assets, trading volumes relative to historical norms, market depth at various price levels, volatility measures, and signs of market stress in related instruments.